
TD Merus Technologies

TD Merus Technologies Logo

Traffic But No Sales

Find out why your traffic is not translating into sales.

Your Analytics Show Traffic But Your Revenue Does Not Reflect It

You can see the numbers in Google Analytics. People are visiting your website. Hundreds, maybe thousands every month. But when you look at your sales, the numbers do not add up. The traffic is there but the revenue is not. At TD MERUS, we find the exact disconnect between your visitors and your sales, then implement the fixes that turn that traffic into actual revenue.
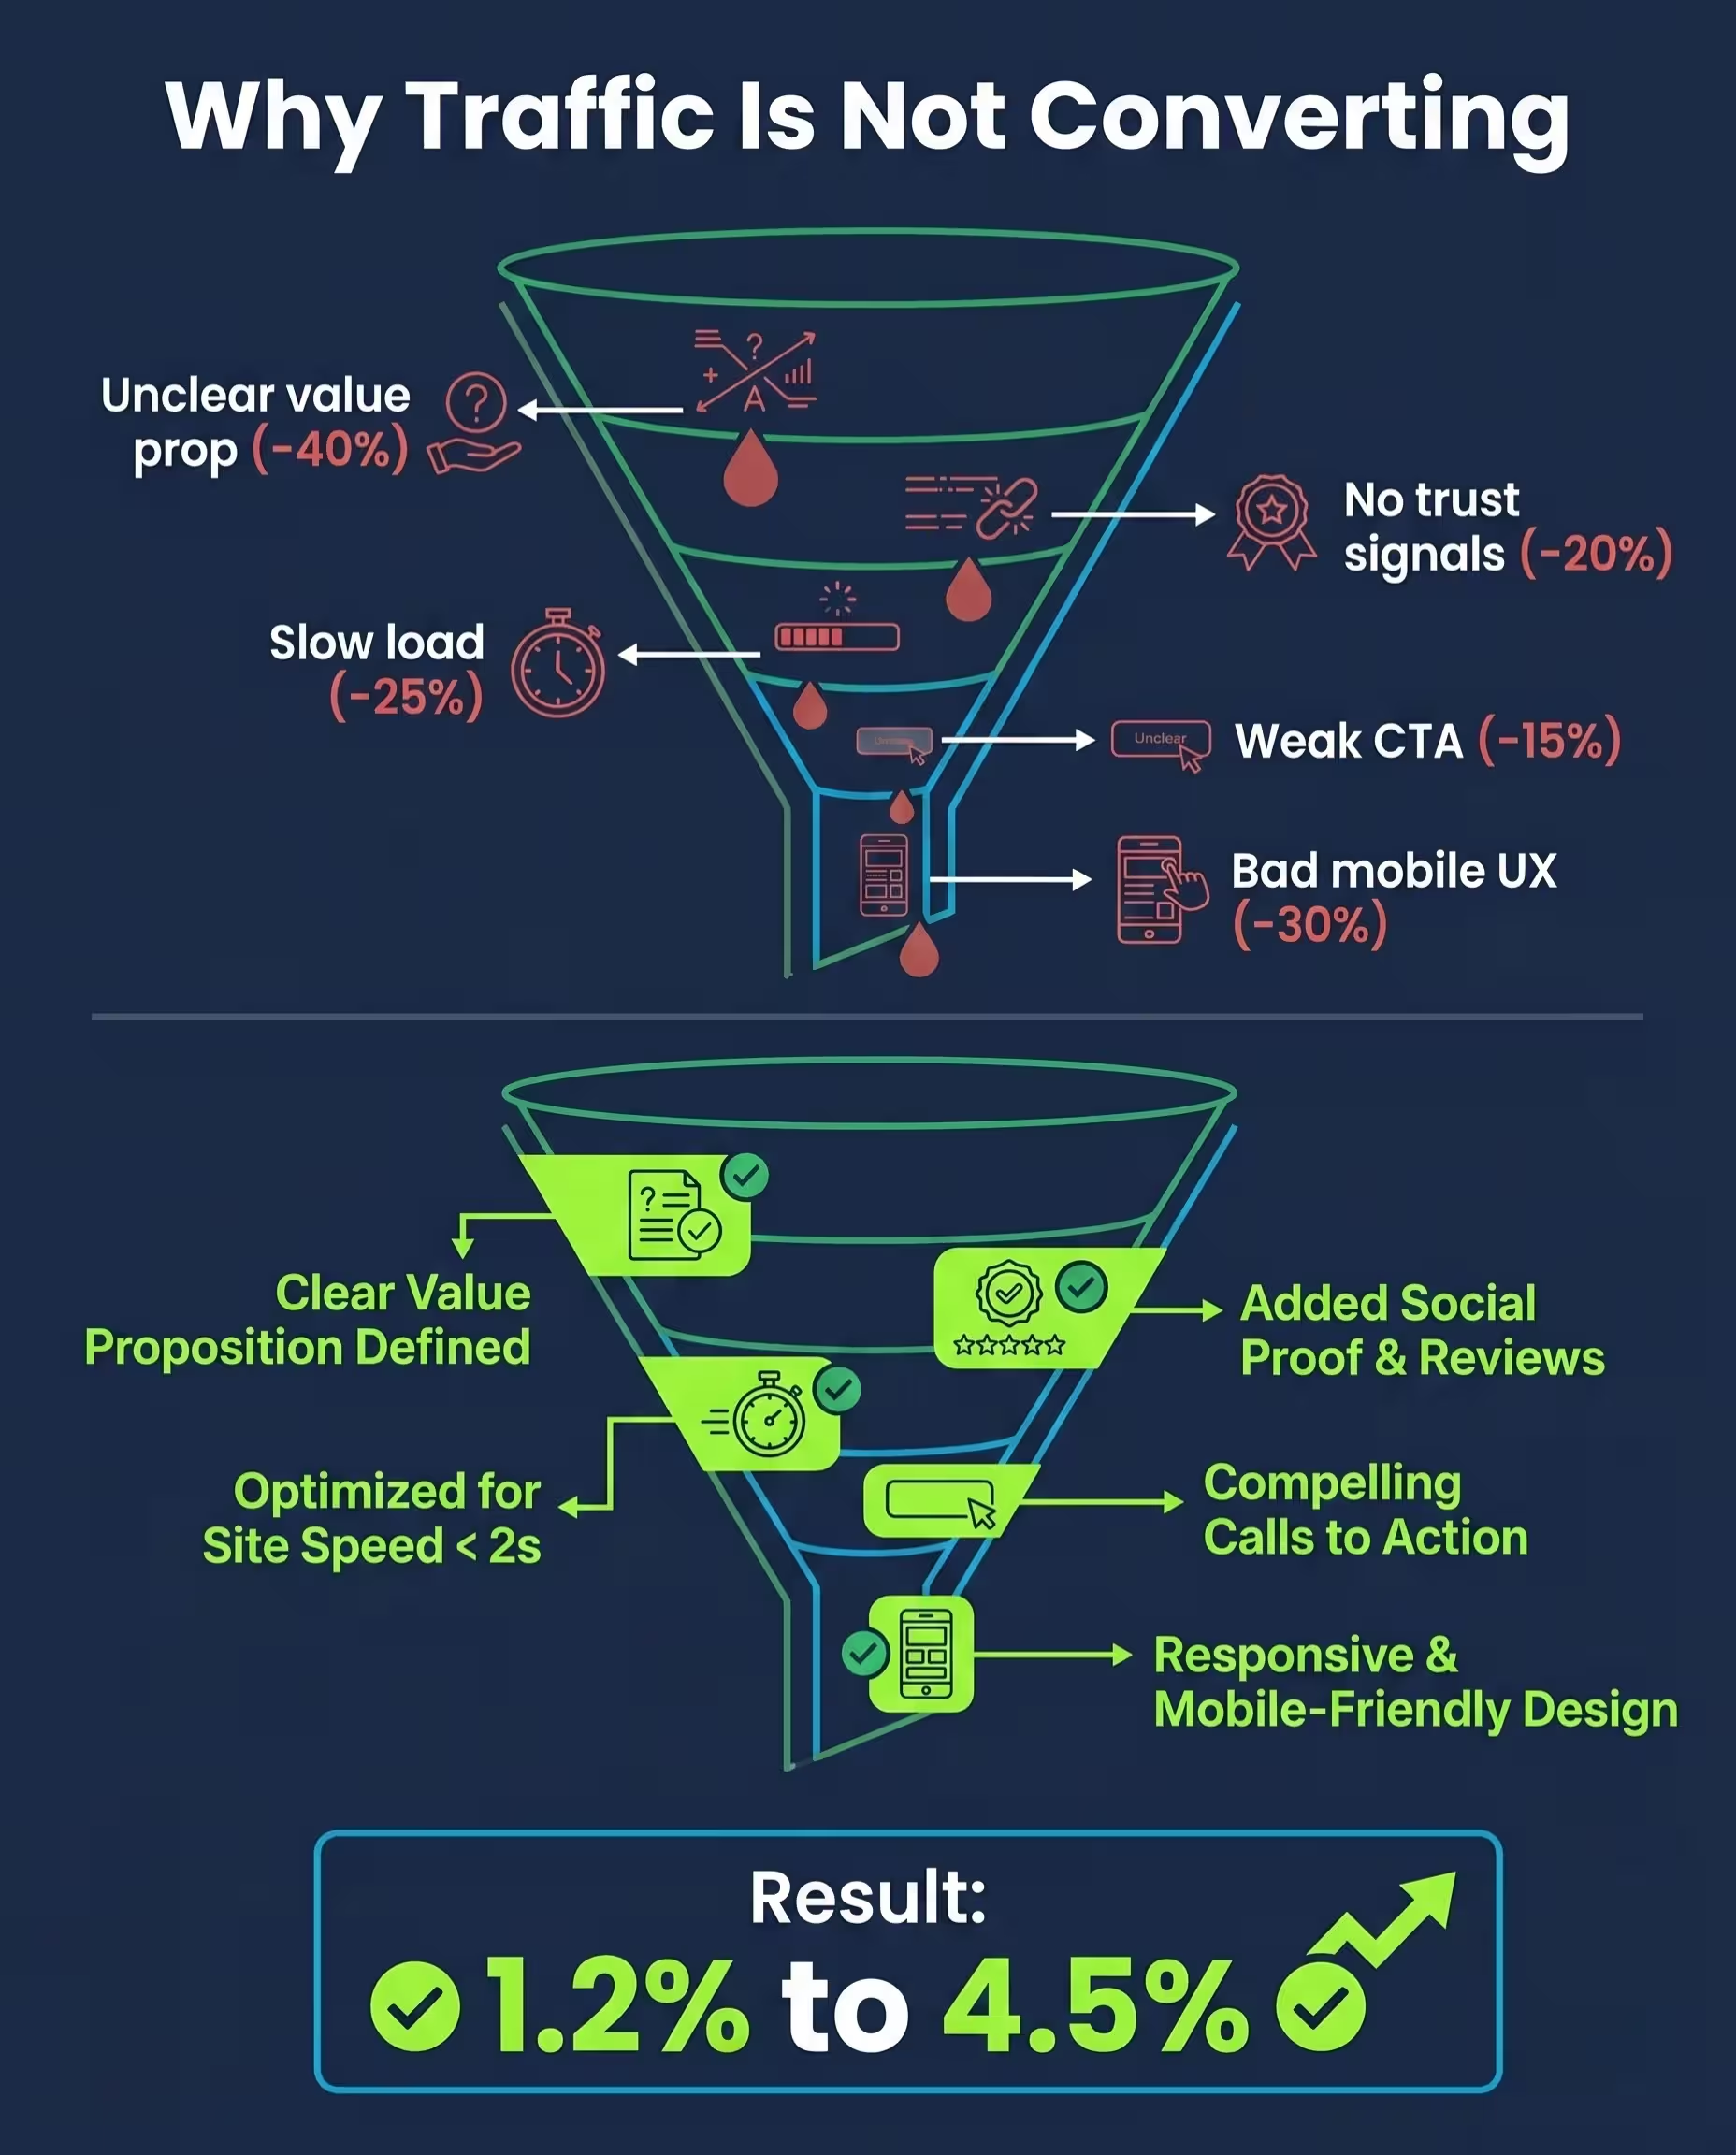
A 4:5 vertical infographic titled 'Why Traffic Is Not Converting' against a deep navy background, designed in a clean data visualization style using Outfit and Poppins fonts. The image features two sales funnels arranged vertically with forest green and ocean blue structural lines, and charcoal gray for subtle borders and muted labels. The top is a conceptual leaky funnel with visual holes, conceptual problem icons (question marks, clocks, broken links, small buttons, small phone screens), and conceptual red drops/loss, accompanied by conceptual Poppins labels with conceptual red percentages indicating loss: 'Unclear value prop (-40%)', 'Slow load (-25%)', 'No trust signals (-20%)', 'Weak CTA (-15%)', 'Bad mobile UX (-30%)'. Below this, a second conceptual 'patched' funnel derived from the first is shown with conceptual vibrant lime green 'fixes' and patches sealing the holes from the top section. The patches feature conceptual vibrant lime green icons and checkmarks (checkmark on value prop document, checkmark on optimized site speed stopwatch, checkmark on trust badge with reviews, strong arrow on clear CTA button, checkmark on well-designed mobile phone screen), connected to conceptual vibrant lime green labels: 'Clear Value Proposition Defined', 'Optimized for Site Speed < 2s', 'Added Social Proof & Reviews', 'Compelling Calls to Action', 'Responsive & Mobile-Friendly Design'. At the very bottom, a conceptual prominent statistic block displays the conceptual result statement: '1.2% to 4.5%' with the conceptual numbers in large, bold, conceptual vibrant lime green Poppins font, emphasized with conceptual vibrant lime green checkmarks and a conceptual upward-trending growth arrow highlighting success indicators.

Why Traffic Alone Does Not Equal Revenue

Traffic is only valuable when it comes from the right people and lands on pages that guide them to buy. There are several common reasons your traffic is not producing sales.


  • You are attracting the wrong visitors who are not your target customers and have no intent to buy
  • Your traffic sources are sending low-quality visitors like bots, irrelevant referrals, or unqualified clicks
  • Visitors land on your site but your pages do not persuade them to take the next step toward purchasing
  • Your products or services are not presented with enough detail, imagery, or social proof to drive a buying decision
  • There is a mismatch between what your ads or search results promise and what visitors find when they arrive
  • Your site does not have a clear path from landing to checkout or inquiry
  • Pricing, shipping costs, or hidden fees surprise visitors late in the buying process and cause abandonment

How We Turn Your Traffic Into Sales

Traffic Quality Analysis

We audit your traffic sources to determine which visitors are real potential customers and which are wasted clicks

Audience Alignment

We adjust your targeting, keywords, and messaging to attract visitors who are actually ready to buy

Landing Page Optimization

We redesign and rewrite key landing pages to match visitor intent and guide them toward purchase

Sales Funnel Mapping

We build a clear path from first visit to completed sale with strategic touchpoints along the way

Product Page Enhancement

We improve product descriptions, images, reviews, and presentation to drive buying decisions

Retargeting Strategy

We implement campaigns that re-engage visitors who showed interest but did not buy on their first visit

Analytics Setup

We configure proper tracking and attribution so you can see exactly which traffic sources drive actual revenue

Pricing and Offer Optimization

We test different pricing presentations, offers, and incentives to find what maximizes revenue

What to Expect

Once we identify and fix the disconnect between your traffic and sales, most clients see revenue improvements within 30 to 60 days. By eliminating wasted traffic spend and optimizing conversion paths, businesses typically see 2x to 4x improvements in revenue from existing traffic levels.

Ready to Turn Traffic Into Revenue?

Traffic without sales is just a cost. Let us turn it into your most profitable asset.

Frequently Asked Questions

We analyze your traffic sources, bounce rates, time on site, and user behavior to determine whether you are attracting the right audience.

Yes, most traffic-to-sales problems are solved by improving what happens after visitors arrive, not by sending more traffic.

Our initial traffic and conversion analysis is typically completed within 1 to 2 weeks, with priority recommendations ready immediately.

Yes, we solve traffic-to-revenue problems for online stores, service companies, SaaS platforms, and lead generation businesses.

Google Analytics 4, Google Search Console, heatmap tools, and platform-specific analytics depending on your setup.

Yes, if your paid traffic is part of the problem, we can audit and optimize your ad campaigns to improve traffic quality and ROAS.

We set up proper conversion tracking and attribution modeling so you can see which channels, campaigns, and keywords drive actual revenue.

We test pricing presentation, bundling, and offer strategies, though we work within the pricing framework you are comfortable with.

Absolutely. A small amount of highly qualified traffic that converts well is more valuable than large volumes of unqualified visitors.

Pricing depends on the complexity of your traffic sources and sales process. We provide a clear quote after our initial analysis.